Redgate Monitor custom metrics
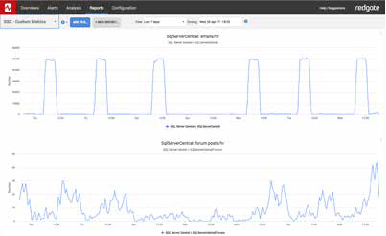
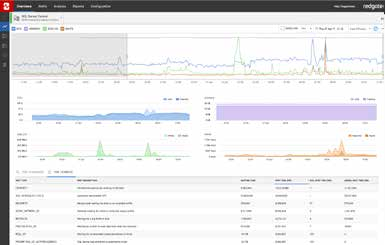
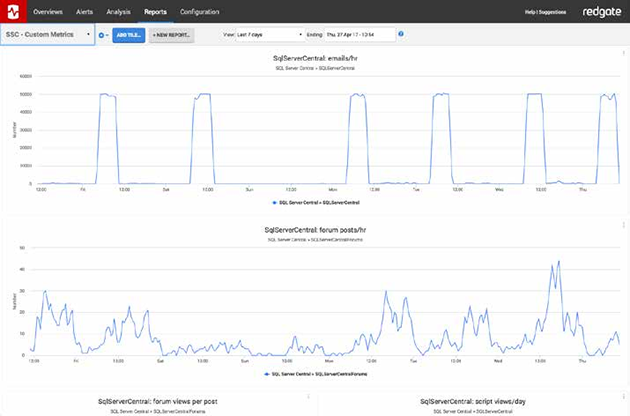
Collect the SQL Server performance data you care about with tried and tested Redgate Monitor custom metrics.
Redgate has brought together a range of custom metrics for you to install directly into Redgate Monitor.
Find custom metrics