Guides
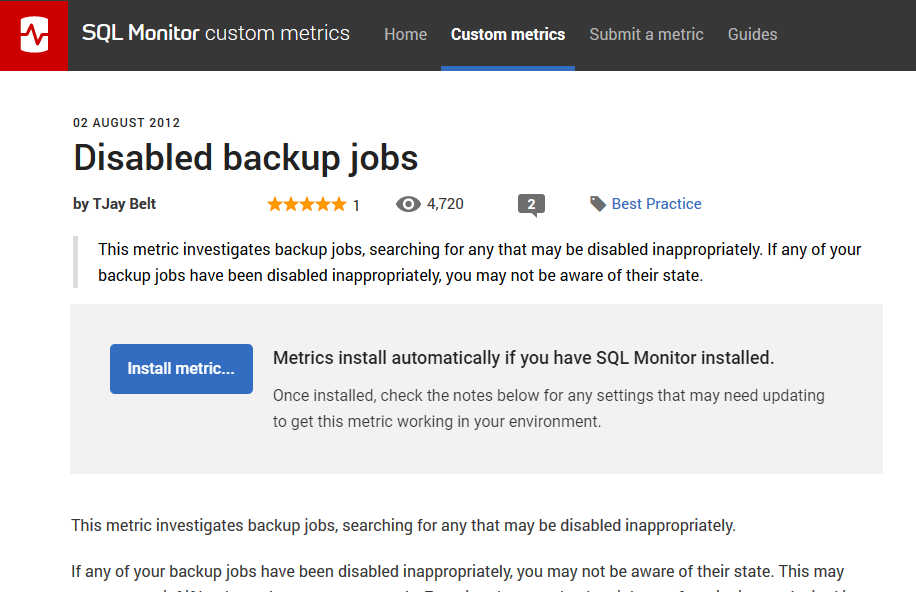
2. Install metric – Click the Install button near the top of the custom metric page. Redgate Monitor’s Create custom metric wizard is displayed in a new tab, with fields automatically populated with the example metric settings.
3. Update settings – Certain settings in this metric must be tuned to match your SQL Server environment, and notes are provided below each setting that needs updating:
- Take a look at the Enter the T-SQL used to collect data setting. There’s a note below the query explaining that specific job names must be replaced with names appropriate to your system. So replace %backup% with the name of your own backup jobs, and Daily Backups.Subplan_1 with the name of any jobs you want to exclude.
- Now look at the note for the Select instances to collect from setting. As advised, turn on the check boxes for the instances you want to run the query against.
- There is also a note for the Define alert thresholds setting. Every alert on this site contains a note about how the thresholds settings are intended as guiding values. For TJay’s metric, he suggests raising a high alert once disabled backup jobs are detected, but you might prefer to raise this at a lower alert level if you don’t believe it deserves top priority.
4. Test metric – To make sure the updated metric will work as expected, click the Test metric collection… button. The dialog displays a list of the MSDB databases for the instances you’ve selected. Click the Test metric collection button. Redgate Monitor runs the query once against each selected database. If the test does not complete successfully, see the section called Test metric collection on Redgate’s Support Center.
5. Now click Next. You can now create an optional custom alert for this metric. Just adjust the thresholds to suit your environment. After clicking Next you are presented with a summary page

6. Now click the Create metric and alert button. The new metric is now listed on the custom metrics page. You’ve now got this example metric working in your environment, and can check the graph on the Analysis page in Redgate Monitor to see collected values plotted as data points.
Writing a metric
by Grant Fritchey
So you’ve seen the example metrics provided on this site, but what if you want to create your own from scratch? Redgate provides documentation on its Support Center detailing everything you need to know. This article is not meant as a replacement for all that work, but rather to show you how I went about writing a custom metric of my own. I’m sharing my thought processes as I set up the metric in order to illustrate what’s possible with this feature.
If you want to automatically install the metric described in this article, it’s available here: Low virtual memory.
The Metric: Low Virtual Memory
There are a number of metrics in SQL Server, and a few in Redgate Monitor, that will inform you about memory use within your servers. But only one of these metrics will absolutely tell you, with certainty that you have memory pressure occurring within your system. In fact, this measure can tell you if you’re suffering from internal, SQL Server, memory issues, or external, Windows OS, memory issues directly. You just have to use the sys.dm_os_ring_buffers dynamic management object (DMO).
I’ve got a guest blog post up on the Microsoft MVP blog that details how this DMO works to monitor your memory. Here we’ll just concentrate on how I use the DMO within Redgate Monitor to set up a custom metric in Redgate Monitor.
Writing the T-SQL
Since a custom metric can only return a single, numeric value that can be null, you need to approach what information you’re gathering carefully. For example, if you were interested in measuring load by looking at worker processes, you could just run a really simple query like this:
|
1 2 3 |
SELECT COUNT(*) FROM sys.dm_os_workers AS dow WHERE state = 'RUNNING'; |
That’s going to gather a number representing the number of active processes that you store. Then that number can be compared to other values for the same metric you collect over time to give you a simplistic indication of load.
With the sys.dm_os_ring_buffers, the measures of memory that the DMO exposes are not useful as a means of creating a custom metric. Oh, they can be. You’ll be able to see how memory allocation goes up and down. However, you can’t supply a specific value that indicates that you have memory pressure, because memory allocation just goes up and down and you might get false positives. We can simplify this a lot. If you’re getting an alert put into the sys.dm_os_ring_buffers for the events
RESOURCE_MEMPHYSICAL_LOW or RESOURCE_MEMVIRTUAL_LOW, then you are, in fact, experiencing memory pressure. This allows me to set up a query for the custom metric like this:
|
1 2 3 4 5 6 7 8 9 10 11 12 13 14 15 16 17 18 19 20 21 22 23 24 25 26 27 28 |
WITH RingBuffer AS (SELECT CAST(record AS XML) AS xRecord, DATEADD( ss, (-1 * ((dosi.cpu_ticks / CONVERT(FLOAT, (dosi.cpu_ticks / dosi.ms_ticks))) - dorb.timestamp) / 1000 ), GETDATE() ) AS DateOccurred FROM sys.dm_os_ring_buffers AS dorb CROSS JOIN sys.dm_os_sys_info AS dosi WHERE ring_buffer_type = 'RING_BUFFER_RESOURCE_MONITOR' ) SELECT TOP 1 CASE (xr.value('(ResourceMonitor/Notification)[1]', 'varchar(75)' ) ) WHEN 'RESOURCE_MEMVIRTUAL_LOW' THEN 1 ELSE 0 END AS LowMemAlert FROM RingBuffer AS rb CROSS APPLY rb.xRecord.nodes('Record') record(xr) WHERE xr.value('(ResourceMonitor/Notification)[1]', 'varchar(75)') = 'RESOURCE_MEMVIRTUAL_LOW' AND rb.DateOccurred > DATEADD(mi, -5, GETDATE()) ORDER BY rb.DateOccurred DESC; |
All I’ve done here is get one value that shows an alert has entered into the ring buffers during the last five minutes. With this query tested, I can now complete all of the other settings required for a Custom Metric in Redgate Monitor.
Setting Up the Custom Metric
The wizard in Redgate Monitor will walk you through all the basics of getting the metric configured how you want it. I’ll just talk about the choices I made in setting up mine.
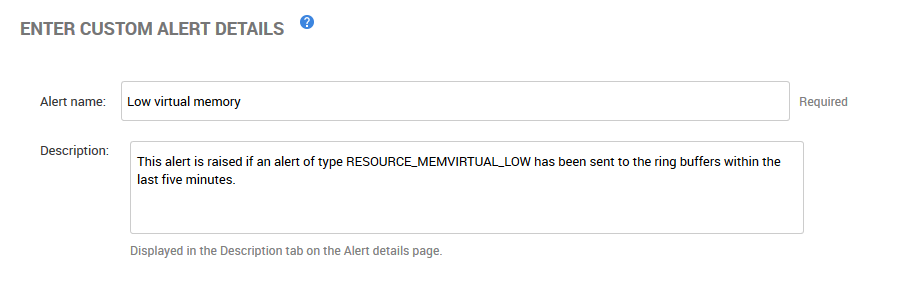
Enter Custom Metric Details
First off, I give it a fairly descriptive name and I provide a good description:
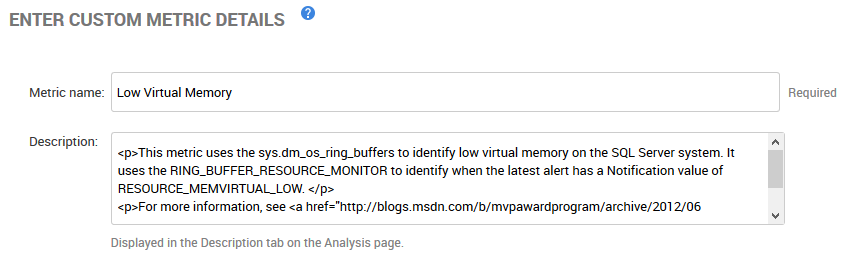
Why do I include a description even though I’m the guy setting up the metric and most likely the person looking at it? One, my memory has never been terribly good, so it’s not a bad idea to provide enough information so that I will always know what this metric is doing. Second, there’s that bus that seems to lurk around corners taking out developers and admins willy-nilly. If I get hit by it, the next person handling my job will be able to understand what this measure is doing and why I put it in place.
Enter the T-SQL Query Used to Collect Data
Next is the query. It’s the same as the one I listed above copied and pasted from testing in a query window:
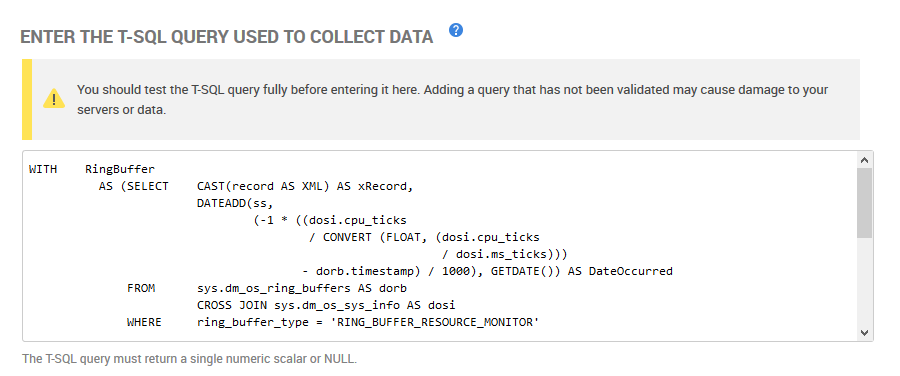
I can’t reemphasize enough the two notes in the wizard. You absolutely must test these queries before you put them into a custom metric. You’re setting something up to run automatically against some number of servers and databases on your system, your production system. You had better understand exactly what sort of impact it’s likely to have when you run it. I’ve seen what seemed like perfectly benign queries become horrible monsters when run once against each of a one hundred databases on a server. The second note is to remind you that the query must return a single numeric scalar value or NULL. Again, don’t lose sight of this one or you’ll be looking at errors or missing information, not good solid metric data.
Select instances and databases to collect from
Now you have to select the servers and databases against which you’re going to gather this metric. Since you can edit metrics after you create them, I’d suggest setting it up against one server, maybe not even a production server, first. Validate that it’s doing exactly what you want, the way you want and then modify it to run against all your servers. Also think about the query that you’re running. In my case, this query will not work on a SQL Server 2000 instance, so I should avoid those instances in my choices below:
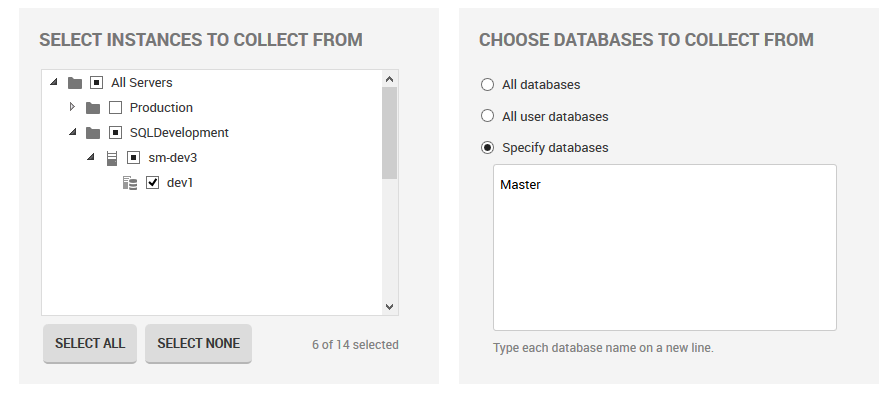
Note, I started off with a development server. I could have selected all the servers of different types and you may do this later, but as I noted above, always test new metrics in a non-production environment against a single server to start.
Since this metric is collecting a system value, it doesn’t make any sense at all to run it against “All databases” or “All user databases” since it’s going to return the same value for all of them. Instead I define a single database to run it against. Due to the nature of this query, I’m using the master database. That’s a safe choice since it will be available on every server that I choose to run this against.
Test Metric Collection
Testing? What a great idea. Use it.
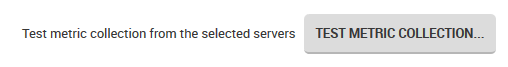
You can select which of the instances you want to run the test against. If you’ve configured it to run against multiple instances, you can test all of them or just a select list. The output from the test is really useful:
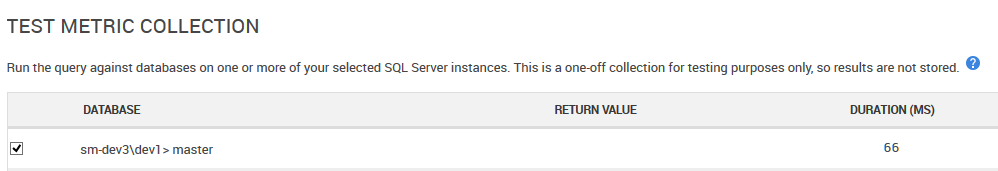
What did it return and how long did it take to return it? They’re the test results you want to see so you can be sure what you’re getting ready to do to your production servers.
Set Collection Frequency and Use Collected Values
The frequency of collection can be chosen from a list, but since I’ve set the query up to only look at the last five minutes worth of information, collecting this information every 10 minutes wouldn’t make a lot of sense:
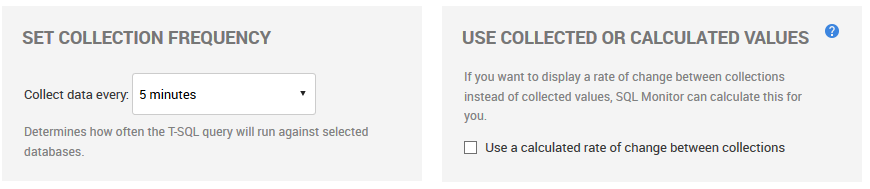
I don’t want to calculate the rate of change on this. I’m looking for NULL or 1, either I have a VAS memory issue or I don’t.
Enable the Metric
Finally, I’m going to enable the collection right out of the box. I’ve seen others set everything up first and then enable it initially during an off-hour or down-time period as an extra act of paranoia. Nothing wrong with being extra paranoid about your production systems, but I’m pretty sure I’ve got things configured correctly (and I’m a bit of a cowboy).

The Alert
The worst thing in the world is an overly chatty monitoring system. It’s like the story of Chicken Little (Henny Penny for you across the pond). If your monitoring system is constantly telling you that the “the sky is falling, the sky is falling” you may stop listening to it. However, you do want to get meaningful alerts. In this case, I’m choosing to make this a part of the alerts for my system.
Enter Custom alert details
As with the custom metric itself, I’m going to provide meaningful names and comments in the alert:
Define alert thresholds
The choices you make for determining what level of alert are very specific to your situation. But, in this case, it’s pretty easy. Anything greater than zero is bad:
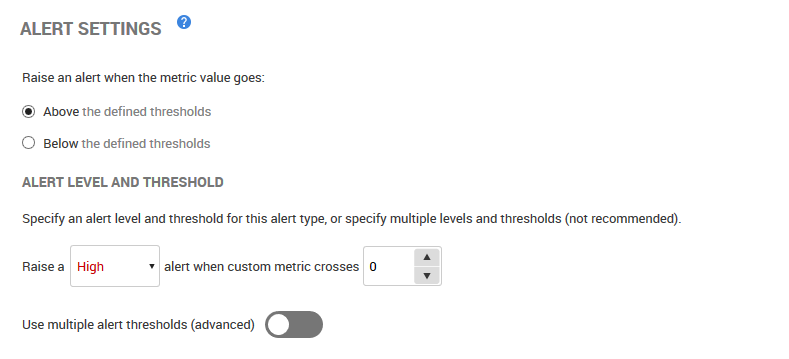
I could have selected any one of the alert levels. I chose high because I’ve trimmed my alerts down quite a lot. Also, in all the testing I’ve done, it took a lot of work to get my server to generate an alert into the ring buffers, including shrinking available memory. This tells me that if I actually do experience it from natural causes, it’s going to be something I want to know about and it’s going to be important, hence, a High level alert.
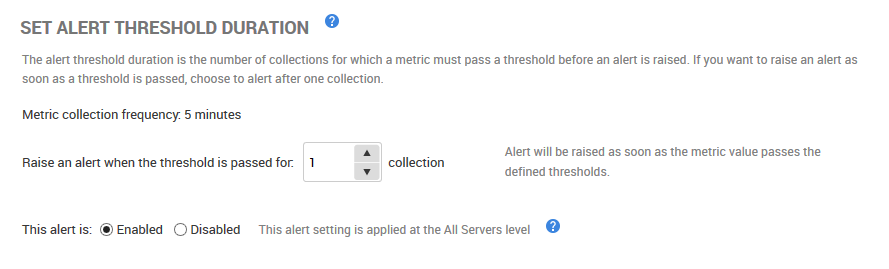
Set Alert Threshold Duration
Determining what it takes to raise the alert is not just a measure of the metric, but of how often the metric has been raised.
For the same reasons as I gave the metric a High level alert, I only need a single occurrence before I want the alert raised. For lower level metrics or something that might be affected by multiple samples, I may want to bump this number up. Finally, I did enable the alert right out of the box, just as I did the metric.
Next, I get a summary page showing me some of the choices I made, but leaving out a lot of the details:
With that, I have created a custom metric and a custom alert.
It’s available for you to install automatically: Low virtual memory.
Because of the nature of this particular metric, I would want to ensure I created two, one for each of the physical/external and virtual/internal memory alerts that can be generated. The overall settings would be the same.
My key recommendations
It’s that easy to set up a custom metric. My main advice would be:
- Take your time, and think through exactly what you’re collecting and how you’re collecting it.
- Pick the right frequency and the right databases to run the metric against.
- Think about whether or not you need an alert at all. If you do, make sure that the alert is going to generate signal and not noise, meaning that it provides you with actionable information when you need it.
So why not try and create a metric of your own? If you share it with other Redgate Monitor users on this site, and you’ll be helping other DBAs to improve their knowledge of SQL Server, and you’ll be acknowledged as the author.