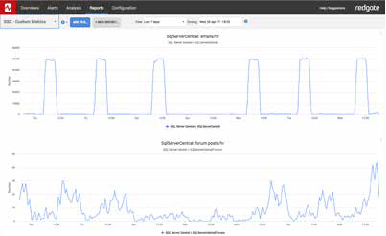
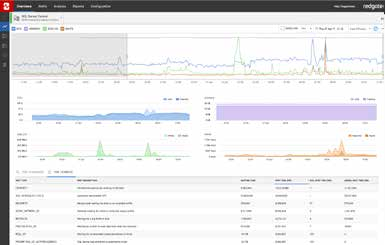
Metrics install automatically if you have Redgate Monitor installed.
If you are using Redgate’s SQL Server monitoring tool, Redgate Monitor, you can instantly install and run this metric on your servers.
This metric gives an idea of how many tasks are in a runnable state and trying to execute in the system concurrently.
Sustained values for the runnable_tasks_count column are usually a very good indicator of CPU pressure, since it means that many tasks are waiting for CPU time. The longer the queue, and the greater the number of schedulers with requests waiting, the more stressed the CPU subsystem is.
Metric definition
Name
Average runnable task count
Description
This metric gives an idea of how many tasks are in a runnable state and trying to execute in the system concurrently.
Sustained values for the runnable_tasks_count column are usually a very good indicator of CPU pressure, since it means that many tasks are waiting for CPU time. The longer the queue, and the greater the number of schedulers with requests waiting, the more stressed the CPU subsystem is.
The T-SQL query that will collect data
Instances to collect from
Select all
Databases to collect from
master
Collection frequency
600
Use collected or calculated values
Leave the Use a calculated rate of change between collections check box unchecked
Metric collection
Enabled
Alert definition
Alert name
CPU pressure (avg runnable task count)
Description
This alert is raised when the number of tasks in a runnable state are trying to execute in the system concurrently, which can indicate CPU pressure.
The metric Average runnable task count on which this alert is based measures values for the runnable_tasks_count column. This is usually a very good indicator of CPU pressure, since it means that many tasks are waiting for CPU time. The longer the queue, and the greater the number of schedulers with requests waiting, the more stressed the CPU subsystem is.
Raise an alert when the metric value goes
Above the defined threshholds
Default threshold values
| High: | 20 |
| Medium: | 10 |
| Low: | 9 |
Note: These thresholds are intended as guideline values. If they seem too high or too low for your environment, replace them with values more suited to your server performance.
Raise an alert when the threshold is passed for
3 collections
Alert is
Enabled
 13,324
