6,606
6,606 Metrics install automatically if you have Redgate Monitor installed.
If you are using Redgate’s SQL Server monitoring tool, Redgate Monitor, you can instantly install and run this metric on your servers.
Measures the total duration of latch waits on the tempdb database, in a one-minute time interval.
First, create and start for the following Extended Events session on the monitored SQL Server instance:
|
1 2 3 4 5 6 7 8 9 10 11 12 13 14 15 16 17 18 19 20 21 |
IF EXISTS --if the session already exists, then delete it. We are assuming you've changed something ( SELECT * FROM sys.server_event_sessions WHERE server_event_sessions.name = 'MonitorTempDBContention' ) DROP EVENT SESSION MonitorTempDBContention ON SERVER; GO CREATE EVENT SESSION MonitorTempDBContention ON SERVER ADD EVENT sqlserver.latch_suspend_end (WHERE([sqlserver].[database_id] = (2))) ADD TARGET package0.ring_buffer WITH (MAX_MEMORY = 4096KB, EVENT_RETENTION_MODE = ALLOW_SINGLE_EVENT_LOSS, MAX_DISPATCH_LATENCY = 30 SECONDS, MAX_EVENT_SIZE = 0KB, MEMORY_PARTITION_MODE = NONE, TRACK_CAUSALITY = OFF, STARTUP_STATE = ON); GO ALTER EVENT SESSION MonitorTempDBContention ON SERVER STATE = START; GO |
The goal is to get the total duration of latch waits, in the last minute, so this session collects all the event data, without any filter except for the database. Its designed to be as lightweight as possible in other regards, collecting only one event, and no additional data.
It might be useful to modify the event session to collect additional event data (“actions”) such as the session_id and sql_text associated with the session that was blocked. However, you’ll need to test it out, gauge how much data it collects over a period, and how much overhead it will cause to have it running continuously.
For further details see: Monitoring TempDB Contention using Extended Events and SQL Monitor.
Metric definition
Name
MonitorTempDBContention
Description
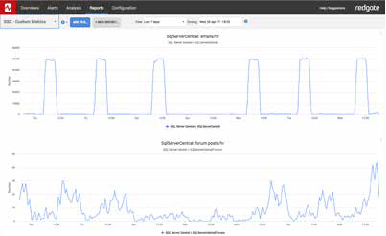
Measures the total duration of latch waits on tempdb, over a period (one-minute time intervals, in this example). Collected over time, this will establish a baseline, showing the typical profile for tempdb latching for your workload, and allow you to spot abnormalities that indicate contention.
The T-SQL query that will collect data
Instances to collect from
Default
Databases to collect from
tempdb
Collection frequency
1 min
Use collected or calculated values
Leave the Use a calculated rate of change between collections check box unchecked
Metric collection
Enabled
Alert definition
The appropriate alert thresholds are entirely dependent on your system, and you should only enable them after establishing a baseline for your working instance.