14,483
 Metrics install automatically if you have Redgate Monitor installed.
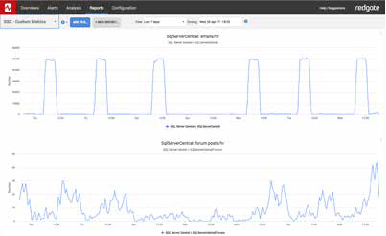
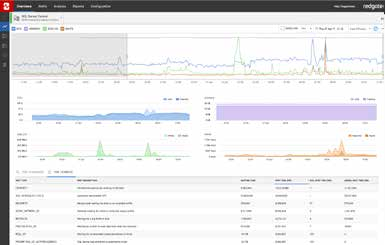
If you are using Redgate’s SQL Server monitoring tool, Redgate Monitor, you can instantly install and run this metric on your servers.
This metric measures the total number of ad hoc queries in the plan cache that have only run one time. The value is only accurate for the instant the query is run, and the value can change radically from one capture time to the next.
Having too many one-time use ad hoc queries in an instance’s plan cache may indicate plan cache bloat, which is a condition where memory in the plan cache is wasted by storing the execution plans of queries that will never be run more than one time. This wasted space can often better be used by the data cache, as generally speaking, the more RAM devoted to the data cache, the faster SQL Server can perform. This particular metric measures the number of one-time use ad hoc queries that are currently in the plan cache.
Keep in mind that this value changes often, and that one-time use ad hoc queries can become multi-use ad hoc queries. For example, if this metric returns 3,500 during one run, it is very possible that 3,450 of these one-time use ad hoc queries may be used a second time before the next time the same metric runs again. Because this value changes often, it is important to maintain a baseline of data in order to establish a “typical” value for this metric for each SQL Server instance.
If the value of this metric is high, then it might be a good idea to turn on the SQL Server option “optimize for ad hoc workloads”. When this option is turned on, then the first time an ad hoc query is executed, the entire execution plan is not stored in the plan cache. Instead, a small stub, taking very little memory is stored. The next time the same ad hoc query runs again, SQL Server will notice this, and this time around, will store the entire execution plan in the plan cache. If your instance has a lot of one-time use ad hoc queries, then turning on “optimize for ad hoc workloads” will prevent plan cache bloat, helping to boost the performance of your SQL Server instance.
Generally speaking, it is not necessary to create an alert for this metric, as you need to watch this value over time. Typically speaking, if this value exceeds 10,000 over time, then there is a good chance your SQL Server may be suffering from plan cache bloat. But this is only an estimated number. The only way to really know if turning on “optimize for ad hoc workloads” will be beneficial is to try it, and then use the custom metric, “Number of Ad Hoc Stubs Created When ‘Optimize for Ad Hoc Workloads’ is Turned On” to determine if turning on “optimize for ad hoc workloads” is effective or not at reducing plan cache bloat.
When deciding if you should turn on “optimize for ad hoc workloads”, consider both the values of this custom metric, plus the Memory used by ad hoc queries running only once custom metric. If both of these metrics are high, then it is likely that your instance is suffering from plan cache bloat.
Metric definition
Name
Ad hoc queries running once
Description
This metric measures the total number of ad hoc queries in the plan cache that have only run one time. The value is only accurate for the instant the query is run, and the value can change radically from one capture time to the next.
Having too many one-time use ad hoc queries in an instance’s plan cache may indicate plan cache bloat, which is a condition where memory in the plan cache is wasted by storing the execution plans of queries that will never be run more than one time. This wasted space can often better be used by the data cache, as generally speaking, the more RAM devoted to the data cache, the faster SQL Server can perform. This particular metric measures the number of one-time use ad hoc queries that are currently in the plan cache.
Keep in mind that this value changes often, and that one-time use ad hoc queries can become multi-use ad hoc queries. For example, if this metric returns 3,500 during one run, it is very possible that 3,450 of these one-time use ad hoc queries may be used a second time before the next time the same metric runs again. Because this value changes often, it is important to maintain a baseline of data in order to establish a “typical” value for this metric for each SQL Server instance.
If the value of this metric is high, then it might be a good idea to turn on the SQL Server option “optimize for ad hoc workloads”. When this option is turned on, then the first time an ad hoc query is executed, the entire execution plan is not stored in the plan cache. Instead, a small stub, taking very little memory is stored. The next time the same ad hoc query runs again, SQL Server will notice this, and this time around, will store the entire execution plan in the plan cache. If your instance has a lot of one-time use ad hoc queries, then turning on “optimize for ad hoc workloads” will prevent plan cache bloat, helping to boost the performance of your SQL Server instance.
Generally speaking, it is not necessary to create an alert for this metric, as you need to watch this value over time. Typically speaking, if this value exceeds 10,000 over time, then there is a good chance your SQL Server may be suffering from plan cache bloat. But this is only an estimated number. The only way to really know if turning on “optimize for ad hoc workloads” will be beneficial is to try it, and then use the custom metric, “Number of Ad Hoc Stubs Created When ‘Optimize for Ad Hoc Workloads’ is Turned On” to determine if turning on “optimize for ad hoc workloads” is effective or not at reducing plan cache bloat.
When deciding if you should turn on “optimize for ad hoc workloads”, consider both the values of this custom metric, plus the Memory used by ad hoc queries running only once custom metric. If both of these metrics are high, then it is likely that your instance is suffering from plan cache bloat.
The T-SQL query that will collect data
Instances to collect from
Select all
Databases to collect from
master
Collection frequency
60
Use collected or calculated values
Leave the Use a calculated rate of change between collections check box unchecked
Metric collection
Enabled
Alert definition
Alert name
Ad hoc queries running once
Description
This alert is raised if the total number of ad hoc queries in the plan cache that have only run one time goes above the specified thresholds. The value is only accurate for the instant the query is run, and the value can change radically from one capture time to the next.
Having too many one-time use ad hoc queries in an instance’s plan cache may indicate plan cache bloat, which is a condition where memory in the plan cache is wasted by storing the execution plans of queries that will never be run more than one time. This wasted space can often better be used by the data cache, as generally speaking, the more RAM devoted to the data cache, the faster SQL Server can perform. The metric that this particular alert is based on measures the number of one-time use ad hoc queries that are currently in the plan cache.
Keep in mind that this value changes often, and that one-time use ad hoc queries can become multi-use ad hoc queries. For example, if this metric returns 3,500 during one run, it is very possible that 3,450 of these one-time use ad hoc queries may be used a second time before the next time the same metric runs again. Because this value changes often, it is important to maintain a baseline of data in order to establish a “typical” value for this metric for each SQL Server instance.
If the value of this metric is high, then it might be a good idea to turn on the SQL Server option “optimize for ad hoc workloads”. When this option is turned on, then the first time an ad hoc query is executed, the entire execution plan is not stored in the plan cache. Instead, a small stub, taking very little memory is stored. The next time the same ad hoc query runs again, SQL Server will notice this, and this time around, will store the entire execution plan in the plan cache. If your instance has a lot of one-time use ad hoc queries, then turning on “optimize for ad hoc workloads” will prevent plan cache bloat, helping to boost the performance of your SQL Server instance.
Generally speaking, it is not necessary to create an alert for this metric, as you need to watch this value over time. Typically speaking, if this value exceeds 10,000 over time, then there is a good chance your SQL Server may be suffering from plan cache bloat. But this is only an estimated number. The only way to really know if turning on “optimize for ad hoc workloads” will be beneficial is to try it, and then use the custom metric, “Number of Ad Hoc Stubs Created When ‘Optimize for Ad Hoc Workloads’ is Turned On” to determine if turning on “optimize for ad hoc workloads” is effective or not at reducing plan cache bloat.
When deciding if you should turn on “optimize for ad hoc workloads”, consider both the values of this custom metric, plus the Memory used by ad hoc queries running only once custom metric. If both of these metrics are high, then it is likely that your instance is suffering from plan cache bloat.
Supported SQL Server versions: SQL Server 2005 or later
Raise an alert when the metric value goes
Above the defined threshholds
Default threshold values
| High: | 20000 |
| Medium: | 15000 |
| Low: | 10000 |
Note: These thresholds are intended as guideline values. If they seem too high or too low for your environment, replace them with values more suited to your server performance.
Raise an alert when the threshold is passed for
10 collections
Alert is
Disabled