16,921
 Metrics install automatically if you have Redgate Monitor installed.
If you are using Redgate’s SQL Server monitoring tool, Redgate Monitor, you can instantly install and run this metric on your servers.
Data pages read from disk are placed in the buffer pool with the intention that they will be reused, and accessing them from RAM is faster than from disk. Knowing how much of your RAM is committed to each database can help you provision the right amount of RAM to SQL Server, and also to identify rogue queries that draw too much data into RAM and force data from other databases out of the cache.
For more information about this metric, see: http://www.simple-talk.com/community/blogs/jonathanallen/archive/2012/06/12/110696.aspx.
Metric definition
Name
Buffer cache used per database
Description
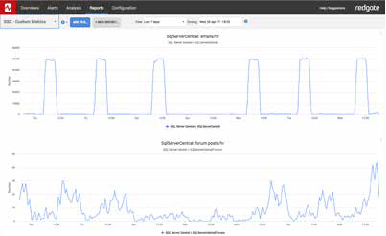
MB of buffer cache dedicated to each database. This will rise and fall as SQL Server manages the memory pages relative to workload in each database. Large, rapid changes in one database that appear to affect other databases (one trace rises while another falls at the same collection time) are worth investigating to ensure your systems are not fighting for physical resources.
Check the results of this and resolve the issues:
SELECT  [sp].[name] AS [server principle] ,
        [sp].[default_database_name] ,
        [sp].[principal_id] ,
        [sp].[sid] ,
        [sp].[type] ,
        [sp].[type_desc] ,
        [sp].[is_disabled]
FROM    [sys].[server_principals] AS sp
        INNER JOIN sys.databases AS d ON [sp].[default_database_name] = d.[name]
WHERE   [d].[state_desc] <> 'online'
ORDER BY [sp].[default_database_name] ,
        [sp].[name];
The T-SQL query that will collect data
Instances to collect from
Select all
Databases to collect from
0
Collection frequency
300
Every 5 minutes, unless you want to investigate in more detail.
Use collected or calculated values
Leave the Use a calculated rate of change between collections check box unchecked
Metric collection
Enabled
Alert definition
An alert is not required