23,828
 Metrics install automatically if you have Redgate Monitor installed.
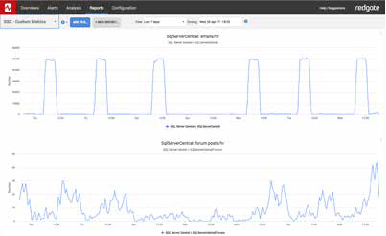
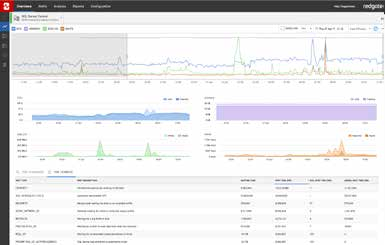
If you are using Redgate’s SQL Server monitoring tool, Redgate Monitor, you can instantly install and run this metric on your servers.
This metric measures the percentage of time spent waiting for CPU resources to service a thread. A high signal wait time for all wait types may indicate that CPUs are being overused, forcing tasks to wait for SQL Server processes. The values are calculated/accumulated as of the last restart of the server, or if they are reset using: [sql]DBCC SQLPERF (‘sys.dm_os_wait_stats’, CLEAR);[/sql]
Metric definition
Name
CPU signal wait time
Description
This metric measures the percentage of time spent waiting for CPU resources to service a thread. A high signal wait time for all wait types may indicate that CPUs are being overused, forcing tasks to wait for SQL Server processes. The values are calculated/accumulated as of the last restart of the server, or if they are reset using:
DBCC SQLPERF ('sys.dm_os_wait_stats', CLEAR);
The T-SQL query that will collect data
Instances to collect from
Select all
Databases to collect from
master
Collection frequency
3600
Use collected or calculated values
Leave the Use a calculated rate of change between collections check box unchecked
Metric collection
Enabled
Alert definition
Alert name
CPU pressure (wait time)
Description
This alert is raised when the percentage of time spent waiting for CPU resources to service a thread goes above a specified threshold. A high signal wait time for all wait types may indicate that CPUs are being overused, forcing tasks to wait for SQL Server processes. The values are calculated/accumulated as of the last restart of the server, or if they are reset using:
DBCC SQLPERF ('sys.dm_os_wait_stats', CLEAR); Raise an alert when the metric value goes
Above the defined threshholds
Default threshold values
| High: | 20 |
| Medium: | 15 |
| Low: | 10 |
Note: These thresholds are intended as guideline values. If they seem too high or too low for your environment, replace them with values more suited to your server performance.
Raise an alert when the threshold is passed for
3 collections
Alert is
Enabled