20,194
 Metrics install automatically if you have Redgate Monitor installed.
If you are using Redgate’s SQL Server monitoring tool, Redgate Monitor, you can instantly install and run this metric on your servers.
You’ve found a metric that you want to use in your SQL Server environment. What should you do next? Getting a metric working in SQL Monitor is easy, and we’ve provided this short walkthrough to help you get started.
In this scenario, you’ve found TJay Belt’s Disabled backup jobs example metric. After reading through the summary, you’ve decided it’s a metric that you want to start monitoring in SQL Monitor v3.2. Here’s what you need to do:
- Install cookies – If you want to download metrics automatically, you must install cookies and make sure cookies are enabled in your Internet browser. If you arrived at this site directly from a link in SQL Monitor, you’ve installed cookies already. If you didn’t, go to the Configuration > Custom metrics page in SQL Monitor, and click on one of the links to sqlmonitormetrics.red-gate.com.
- Install metric – Click the Install button near the top of this page. SQL Monitor’s Create custom metric wizard is displayed in a new tab, with fields automatically populated with the example metric settings.
- Update settings – Certain settings in this metric must be tuned to match your SQL Server environment, and notes are provided below each setting that needs updating:
- Take a look at the Enter the T-SQL used to collect data setting. There’s a note below the query explaining that specific job names must be replaced with names appropriate to your system. So replace: [sql]’%backup%'[/sql] with the name of your own backup jobs, and: [sql]’Daily Backups.Subplan_1′[/sql] with the name of any jobs you want to exclude.
- Now look at the note for the Select instances to collect from setting. As advised, turn on the check boxes for the instances you want to run the query against.
- There is also a note for the Define alert thresholds setting. Every alert on this site contains a note about how the thresholds settings are intended as guideling values. For TJay’s metric, he suggests raising a high alert once disabled backup jobs are detected, but you might prefer to raise this at a lower alert level if you don’t believe it deserves top priority.
- Test metric – To make sure the updated metric will work as expected, click the Test metric collection… button. The dialog displays a list of the MSDB databases for the instances you’ve selected. Click the Test metric collection button. SQL Monitor runs the query once against each selected database. If the test does not complete successfully, see the section called Test metric collection on Red Gate’s Support Center.
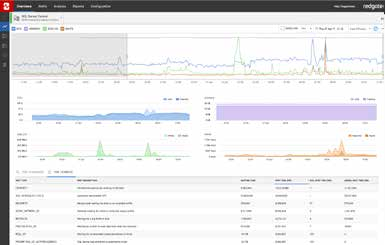
- Create metric – In the Create custom metric wizard, click Next until the Summary page is displayed. Now click the Create metric and alert button. The new metric is listed on the custom metrics page: <screenshot>
You’ve now got this example metric working in your environment, and can check the graph on the Analysis page in SQL Monitor to see collected values plotted as data points.
Metric definition
Name
Disabled backup jobs
Description
This metric investigates backup jobs, searching for any that may be disabled inappropriately.
If any of your backup jobs have been disabled inappropriately, you may not be aware of their state. This may cause you grief if backups do not occur properly. Ensuring that your backup jobs are functioning as desired is paramount. Monitoring them is vital to the health of your topology.
The T-SQL query that will collect data
Instances to collect from
Manually select instances containing the databases you’re interested in
Databases to collect from
MSDB
Collection frequency
86400
Use collected or calculated values
Leave the Use a calculated rate of change between collections check box unchecked
Metric collection
Enabled
Alert definition
Alert name
Disabled backup jobs
Description
This alert is raised when named backup jobs are in a disabled state. It keeps a vigilant eye on your systems, ensuring that the appropriate jobs remain in an enabled state, and allowing their functionality to continue executing properly.
Execute the following query to see status of all backup jobs:
SELECT
        @@ServerName AS [ServerName],
        sj.[Name],
        CASE
          WHEN sj.[enabled] = 1 THEN 'Enabled'
          ELSE 'Not Enabled - Please Investigate'
        END AS [Enabled],
        ISNULL( run_date, '') AS [Run_Date]
      FROM msdb.dbo.sysjobs sj
        left outer join (
                          SELECT
                              MAX(CASE
                                    WHEN run_date is NULL THEN ''
                                    else
                                      substring ( CONVERT( VARCHAR, sh.run_date), 1, 4) + '-'
                                        + substring ( CONVERT( VARCHAR, sh.run_date), 5, 2) + '-'
                                        + substring ( CONVERT( VARCHAR, sh.run_date), 7, 2)
                                  end) AS [run_date],
                              job_id
                            FROM msdb.dbo.sysjobhistory sh
                            where Step_id = 0
                            GROUP BY job_id
                        ) AS sh on sh.job_id = sj.job_id
      WHERE sj.name LIKE '%backup%'
        AND sj.name NOT in ('Daily Backups.Subplan_1')
      ORDER BY [run_date] DESC, sj.[name]
Raise an alert when the metric value goes
Above the defined threshholds
Default threshold values
| High: | 0 |
| Medium: | Turn off check box |
| Low: | Turn off check box |
Note: These thresholds are intended as guideline values. If they seem too high or too low for your environment, replace them with values more suited to your server performance.
Raise an alert when the threshold is passed for
1 collection
Alert is
Enabled