27,823
 Metrics install automatically if you have Redgate Monitor installed.
If you are using Redgate’s SQL Server monitoring tool, Redgate Monitor, you can instantly install and run this metric on your servers.
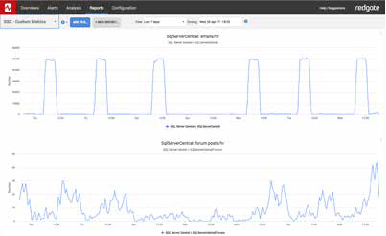
This metric measures the number of database autogrowth events (data file or log file) in the last hour. Too many autogrowth events causes disk fragmentation which requires a change in the autogrowth settings of a database.
To analyze further, execute the following query to find the growth rate and growth duration for each database over the last 24 hours:
[sql]/*Get the name of the current default trace file*/
DECLARE @filename NVARCHAR(1000)
SELECT @filename = CAST(value AS NVARCHAR(1000))
FROM sys.fn_trace_getinfo(DEFAULT)
WHERE traceid = 1 AND property = 2
/*separate file name into pieces*/
DECLARE @bc INT,
@ec INT,
@bfn VARCHAR(1000),
@efn VARCHAR(10)
SET @filename = REVERSE(@filename)
SET @bc = CHARINDEX(‘.’,@filename)
SET @ec = CHARINDEX(‘_’,@filename)+1
SET @efn = REVERSE(SUBSTRING(@filename,1,@bc))
SET @bfn = REVERSE(SUBSTRING(@filename,@ec,LEN(@filename)))
/*set filename without rollover number*/
SET @filename = @bfn + @efn
/*process all trace files and insert data into DB_AutoGrow_Log*/
SELECT ftg.StartTime,
te.name ‘EventName’,
DB_NAME(ftg.databaseid) ‘DatabaseName’,
ftg.[Filename] ‘FileName’,
(ftg.IntegerData*8)/1024.0 ‘GrowthMB’,
(ftg.duration)/1000000.0 ‘Duration_Secs’
FROM fn_trace_gettable(@filename, DEFAULT) AS ftg INNER JOIN sys.trace_events AS te ON ftg.EventClass = te.trace_event_id
WHERE (ftg.EventClass = 92 OR ftg.EventClass = 93) — Date File Auto-grow, Log File Auto-grow
AND DatabaseID = DB_ID()
AND ftg.StartTime > DATEADD(dd, -1, GETDATE())[/sql]
For more information, see SQL Server Database Growth and Autogrowth Settings.
Metric definition
Name
Database autogrowth
Description
Measures the number of database autogrowth events (data file or log file) in the last hour. Too many autogrowth events causes disk fragmentation which requires a change in the autogrowth settings of a database.
To analyze further, execute the following query to find the growth rate and growth duration for each database over the last 24 hours:
/*Get the name of the current default trace file*/
DECLARE @filename NVARCHAR(1000)

SELECT @filename = CAST(value AS NVARCHAR(1000))
FROM sys.fn_trace_getinfo(DEFAULT)
WHERE traceid = 1 AND property = 2

/*separate file name into pieces*/
DECLARE @bc INT,
@ec INT,
@bfn VARCHAR(1000),
@efn VARCHAR(10)

SET @filename = REVERSE(@filename)
SET @bc = CHARINDEX('.',@filename)
SET @ec = CHARINDEX('_',@filename)+1
SET @efn = REVERSE(SUBSTRING(@filename,1,@bc))
SET @bfn = REVERSE(SUBSTRING(@filename,@ec,LEN(@filename)))

/*set filename without rollover number*/
SET @filename = @bfn + @efn

/*process all trace files and insert data into DB_AutoGrow_Log*/
SELECT ftg.StartTime,
te.name 'EventName',
DB_NAME(ftg.databaseid) 'DatabaseName',
ftg.[Filename] 'FileName',
(ftg.IntegerData*8)/1024.0 'GrowthMB',
(ftg.duration)/1000000.0 'Duration_Secs'
FROM fn_trace_gettable(@filename, DEFAULT) AS ftg INNER JOIN sys.trace_events AS te ON ftg.EventClass = te.trace_event_id
WHERE (ftg.EventClass = 92 OR ftg.EventClass = 93) -- Date File Auto-grow, Log File Auto-grow
AND DatabaseID = DB_ID()
AND ftg.StartTime > DATEADD(dd, -1, GETDATE())
The T-SQL query that will collect data
Instances to collect from
Select all
Databases to collect from
0
Collection frequency
3600
Use collected or calculated values
Leave the Use a calculated rate of change between collections check box unchecked
Metric collection
Enabled
Alert definition
Alert name
Database autogrowth
Description
Raise an alert when the metric value goes
Above the defined threshholds
Default threshold values
| High: | 10 |
| Medium: | 5 |
| Low: | 2 |
Note: These thresholds are intended as guideline values. If they seem too high or too low, replace them with values more suited to your environment.
Raise an alert when the threshold is passed for
1 collection
Alert is
Enabled