25,061
 Metrics install automatically if you have Redgate Monitor installed.
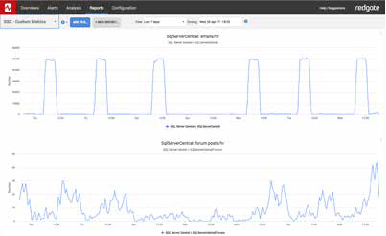
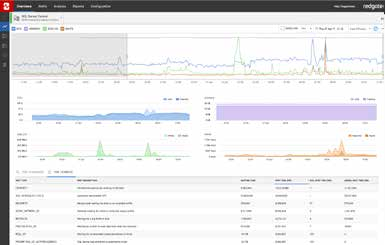
If you are using Redgate’s SQL Server monitoring tool, Redgate Monitor, you can instantly install and run this metric on your servers.
sp_Blitz™ is a health check script created by Brent Ozar. It looks for configuration, security, health and performance problems, and reports back with a list of issues for you to look into. It’s great for quickly understanding the state of a server you’ve been asked to look after.
The list of issues is the script’s major draw. However, if you run the script regularly, it can also help you keep track of whether your server is getting better or worse. To help with tracking of changes, Brent added an option to make the sproc return a count of the issues found. This custom metric lets you monitor the health of your server by tracking that count.
To run this metric, you’ll need to download the script and install it on your SQL Server. Follow these instructions on Brent’s site.
You may want to adjust the @IgnorePrioritiesAbove parameter to exclude less important issues from the count. To do this, see the parameter documentation on Brent’s site.
Metric definition
Name
Issues found by sp_Blitz
Description
This metric keeps track of the number of server issues found by sp_Blitz™. For the full list of issues, run “EXEC sp_Blitz”.
The T-SQL query that will collect data
Instances to collect from
Select all
Databases to collect from
master
Collection frequency
86400
Use collected or calculated values
Leave the Use a calculated rate of change between collections check box unchecked
Metric collection
Enabled
Alert definition
An alert is not required