13,424
 Metrics install automatically if you have Redgate Monitor installed.
If you are using Redgate’s SQL Server monitoring tool, Redgate Monitor, you can instantly install and run this metric on your servers.
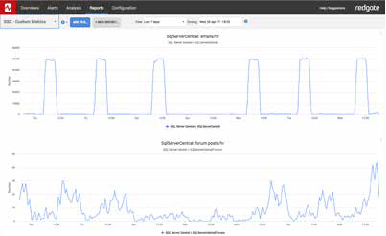
This metric gives you an indication of how much time is spent waiting to send information over a network. High values may indicate slow network performance, but may also indicate that clients are not fetching data quickly, or are leaving connections open with data still available to be fetched.
An alert is not defined, because the “normal” value for this metric can vary greatly from system to system. You could add an alert once the baseline for your environment has been established.
Metric definition
Name
OS Wait Time: Async_Network_IO (secs)
Description
Asynchronous network IO references the amount of time that SQL Server processes spend waiting on data to be transmitted to and from the client. High values may indicate slow network performance, but may also indicate that clients are not fetching data quickly, or are leaving connections open with data still available to be fetched. Values are displayed in seconds, and are collected once per server (this is a server-centric value).
The T-SQL query that will collect data
Instances to collect from
Select all
Databases to collect from
master
Collection frequency
600
Use collected or calculated values
Check the Use a calculated rate of change between collections check box
Metric collection
Enabled
Alert definition
An alert is not defined