7,707
7,707 Metrics install automatically if you have Redgate Monitor installed.
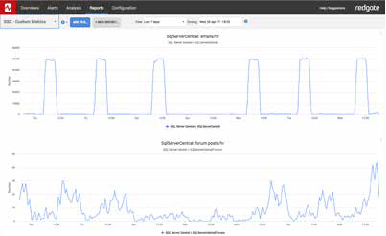
If you are using Redgate’s SQL Server monitoring tool, Redgate Monitor, you can instantly install and run this metric on your servers.
We’d like to thank everyone who entered our custom metrics competition. It was challenging to pick the three winning entries, but the judges’ final decision is in and the winners are:
- Richard Slim for his Mirroring latency metric, giving you data to show the number of seconds by which mirroring is delayed. Judge Steve Jones (@way0utwest), editor-in-chief for SQL Server Central, commented that this metric provides a ‘good indicator of issues with mirroring’, and we anticipate that this will prove useful for many DBAs.
- Muhammad Al Pasha for his Percentage of database free space metric, showing you both reserved and used free space percentage for the database. Judge Jonathan Allen (@fatherjack), Friend of Red Gate, commented that this metric is ‘more meaningful than simple space used’, as it gives the DBA a good indication of the timeframe during which they need to take action.
- Blaž Dakskobler for his Percentage of used/available database space metric that takes into account database current size, used space, maximum size and free space for each drive where database files are located. This will help database administrators keep control of the database storage area.
Congratulations to all three winners, who will each receive a Kindle Fire or the equivalent value in Amazon vouchers. These three useful metrics are published on this site, allowing SQL Monitor users to quickly and easily install them and benefit from the added insight they bring.
Metric definition
Name
Description
The T-SQL query that will collect data
Instances to collect from
Databases to collect from
Collection frequency
Use collected or calculated values
Leave the Use a calculated rate of change between collections check box unchecked
Metric collection
Alert definition
Alert name
Description
Raise an alert when the metric value goes
the defined threshholds
Default threshold values
| High: | |
| Medium: | |
| Low: |
Raise an alert when the threshold is passed for
collections