 14
14 Tablespace Used % – USERS
A permanent tablespace that fills up forces Oracle to throw ORA-01653 / ORA-01654 and halts the operations that need space. This metric tracks the used percentage of a tablespace, already accounting for the autoextend maximum, so it reflects true remaining headroom rather than just current file size. Create one instance of this metric per permanent […] Read moreTablespace Used % (worst per container)
Creating one metric per tablespace works, but a single metric that tracks the worst permanent tablespace in each container covers every tablespace in every PDB — including ones created later — and names the offenders in the alert. Required permissions: GRANT SELECT ON CDB_TABLESPACE_USAGE_METRICS TO redgate_monitor_user CONTAINER=ALL; GRANT SELECT ON CDB_TABLESPACES TO redgate_monitor_user CONTAINER=ALL; These […] Read moreRMAN Full Backup Failures (24h)
RMAN is Oracle’s built-in backup and recovery utility, and most environments schedule full (or level-0 incremental) database backups on a recurring cycle. When a backup job’s STATUS is recorded as FAILED, the most recent full-backup attempt did not produce a usable backup, directly threatening your recovery point objective if it goes unnoticed. Required permissions: GRANT […] Read moreRMAN Archived-Log Backup Failures (24h)
In addition to full database backups, most recovery strategies also back up archived redo logs so that point-in-time recovery is possible between full backups. A failed archived-log backup job breaks that chain and can leave a recovery gap even when the most recent full backup succeeded. Required permissions: GRANT SELECT ON V_$RMAN_BACKUP_JOB_DETAILS TO redgate_monitor_user CONTAINER=ALL; […] Read moreInvalid Objects (Count)
Invalid objects are views, PL/SQL packages, procedures, functions, triggers, and materialized views whose status has changed to INVALID, typically because a dependency was altered or dropped. A small number is often transient and self-resolving, but a growing or persistent count can point to a failed deployment, a missing grant, or a dependency issue that will […] Read moreInternal Errors ORA-600 / ORA-7445 (last hour)
ORA-00600 (internal error) and ORA-07445 (operating-system exception) indicate that Oracle hit a condition its own code did not expect. They can signal bugs, corruption, or resource problems and should always be investigated, often with a support SR. Required permissions: GRANT SELECT ON V_$DIAG_ALERT_EXT TO redgate_monitor_user CONTAINER=ALL; GRANT SELECT ON V_$CONTAINERS TO redgate_monitor_user CONTAINER=ALL; These are […] Read moreHost CPU Utilisation %
Sustained high CPU starves every session on the instance and is a leading indicator of run-away queries or under-sized hardware. This type of monitoring can create white noise in a CPU busy system — only use if the database has been appropriately sized and CPU > 90 is an anomaly that must be addressed. Required […] Read moreDeadlocks (last hour)
Oracle automatically resolves deadlocks by rolling back one statement and writing ORA-00060 to the alert log. Because the database recovers on its own, deadlocks are easy to miss — yet a rising deadlock rate points to an application locking-order problem. Required permissions: GRANT SELECT ON V_$DIAG_ALERT_EXT TO redgate_monitor_user CONTAINER=ALL; GRANT SELECT ON V_$CONTAINERS TO redgate_monitor_user […] Read moreBlocked Sessions
A blocked session is one waiting on a lock held by another session. A few brief blocks are normal; sustained or growing blocking indicates a contention problem or a long-running transaction that is holding locks. Required permissions: GRANT SELECT ON V_$SESSION TO redgate_monitor_user CONTAINER=ALL; GRANT SELECT ON V_$CONTAINERS TO redgate_monitor_user CONTAINER=ALL; These are covered by […] Read more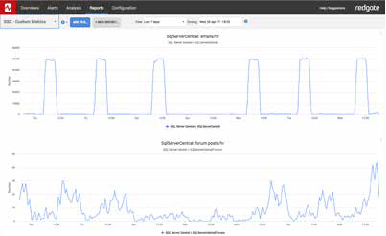
What are custom metrics?
The Redgate Monitor custom metric feature lets you run T-SQL queries against your SQL Servers to collect specific data. You can analyze and receive alerts about your custom data just like everything else Redgate Monitor collects.
But what if you don’t want to write your own queries? No problem. Redgate has brought together a range of quality custom metrics for you to use in Redgate Monitor, which are all are free, tried and tested. You can install straight away, and use the resources on this site to help you write your own.
See the Getting Started guides
What is Redgate Monitor?
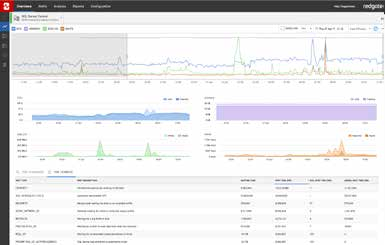
Redgate Monitor is a SQL Server performance monitoring tool that gives you real-time and historical SQL Server performance data with alerts and diagnostics.
With its embedded expertise from SQL Server experts and MVPs, it gives you the information and advice you need to find and fix issues before users are even aware.
Find out more about Redgate Monitor
Featured custom metrics
Total database file size
This custom metric measures the total database file size (data files and log file combined). An increase in this metric signals that a database was grown. When not done by the DBA, this is an autogrow. Excessive autogrow events should be prevented as this can result to file fragmentation. Try to manually grow files before […] Read more
Number of active backups and restores
This metric will display the total number of active backups and restores on a server. This can be used to correlate with other metrics to explain why disk IO and CPU usage could have changed. Read more
Full backup to odd path
This custom metric queries the MSDB database to search for multiple paths for a full backup Read more