Cached pages in TempDB (MB)
 17,037
0
17,037
0
9,515
0
22,247
0
7,817
0
14,673
0
24,027
0
20,824
3
30,201
0
61,306
0
7,610
0
17,037
0
17,037
0
9,515
0
22,247
0
7,817
0
14,673
0
24,027
0
20,824
3
30,201
0
61,306
0
7,610
0
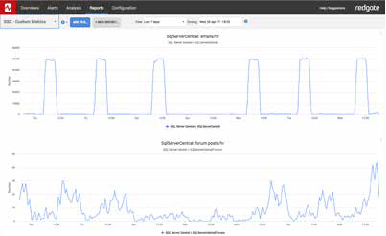
The Redgate Monitor custom metric feature lets you run SQL queries against your databases to collect specific data. You can analyze and receive alerts about your custom data just like everything else Redgate Monitor collects.
But what if you don’t want to write your own queries? No problem. Redgate has brought together a range of quality custom metrics for you to use in Redgate Monitor, which are all are free, tried and tested. You can install straight away, and use the resources on this site to help you write your own.
See the Getting Started guides
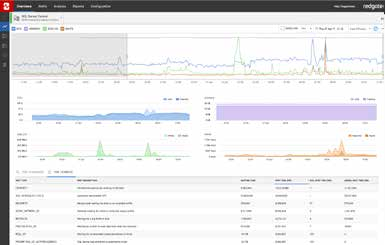
Redgate Monitor is a database performance monitoring tool that gives you real-time and historical performance data with alerts and diagnostics.
With its embedded expertise from database experts and MVPs, it gives you the information and advice you need to find and fix issues before users are even aware.
Find out more about Redgate Monitor
This custom metric measures the total database file size (data files and log file combined). An increase in this metric signals that a database was grown. When not done by the DBA, this is an autogrow. Excessive autogrow events should be prevented as this can result to file fragmentation. Try to manually grow files before […] Read more
This metric will display the total number of active backups and restores on a server. This can be used to correlate with other metrics to explain why disk IO and CPU usage could have changed. Read more
This custom metric queries the MSDB database to search for multiple paths for a full backup Read more